What is hintloop?
When you login to your hintloop dashboard after connecting your first GPT you will see several things:
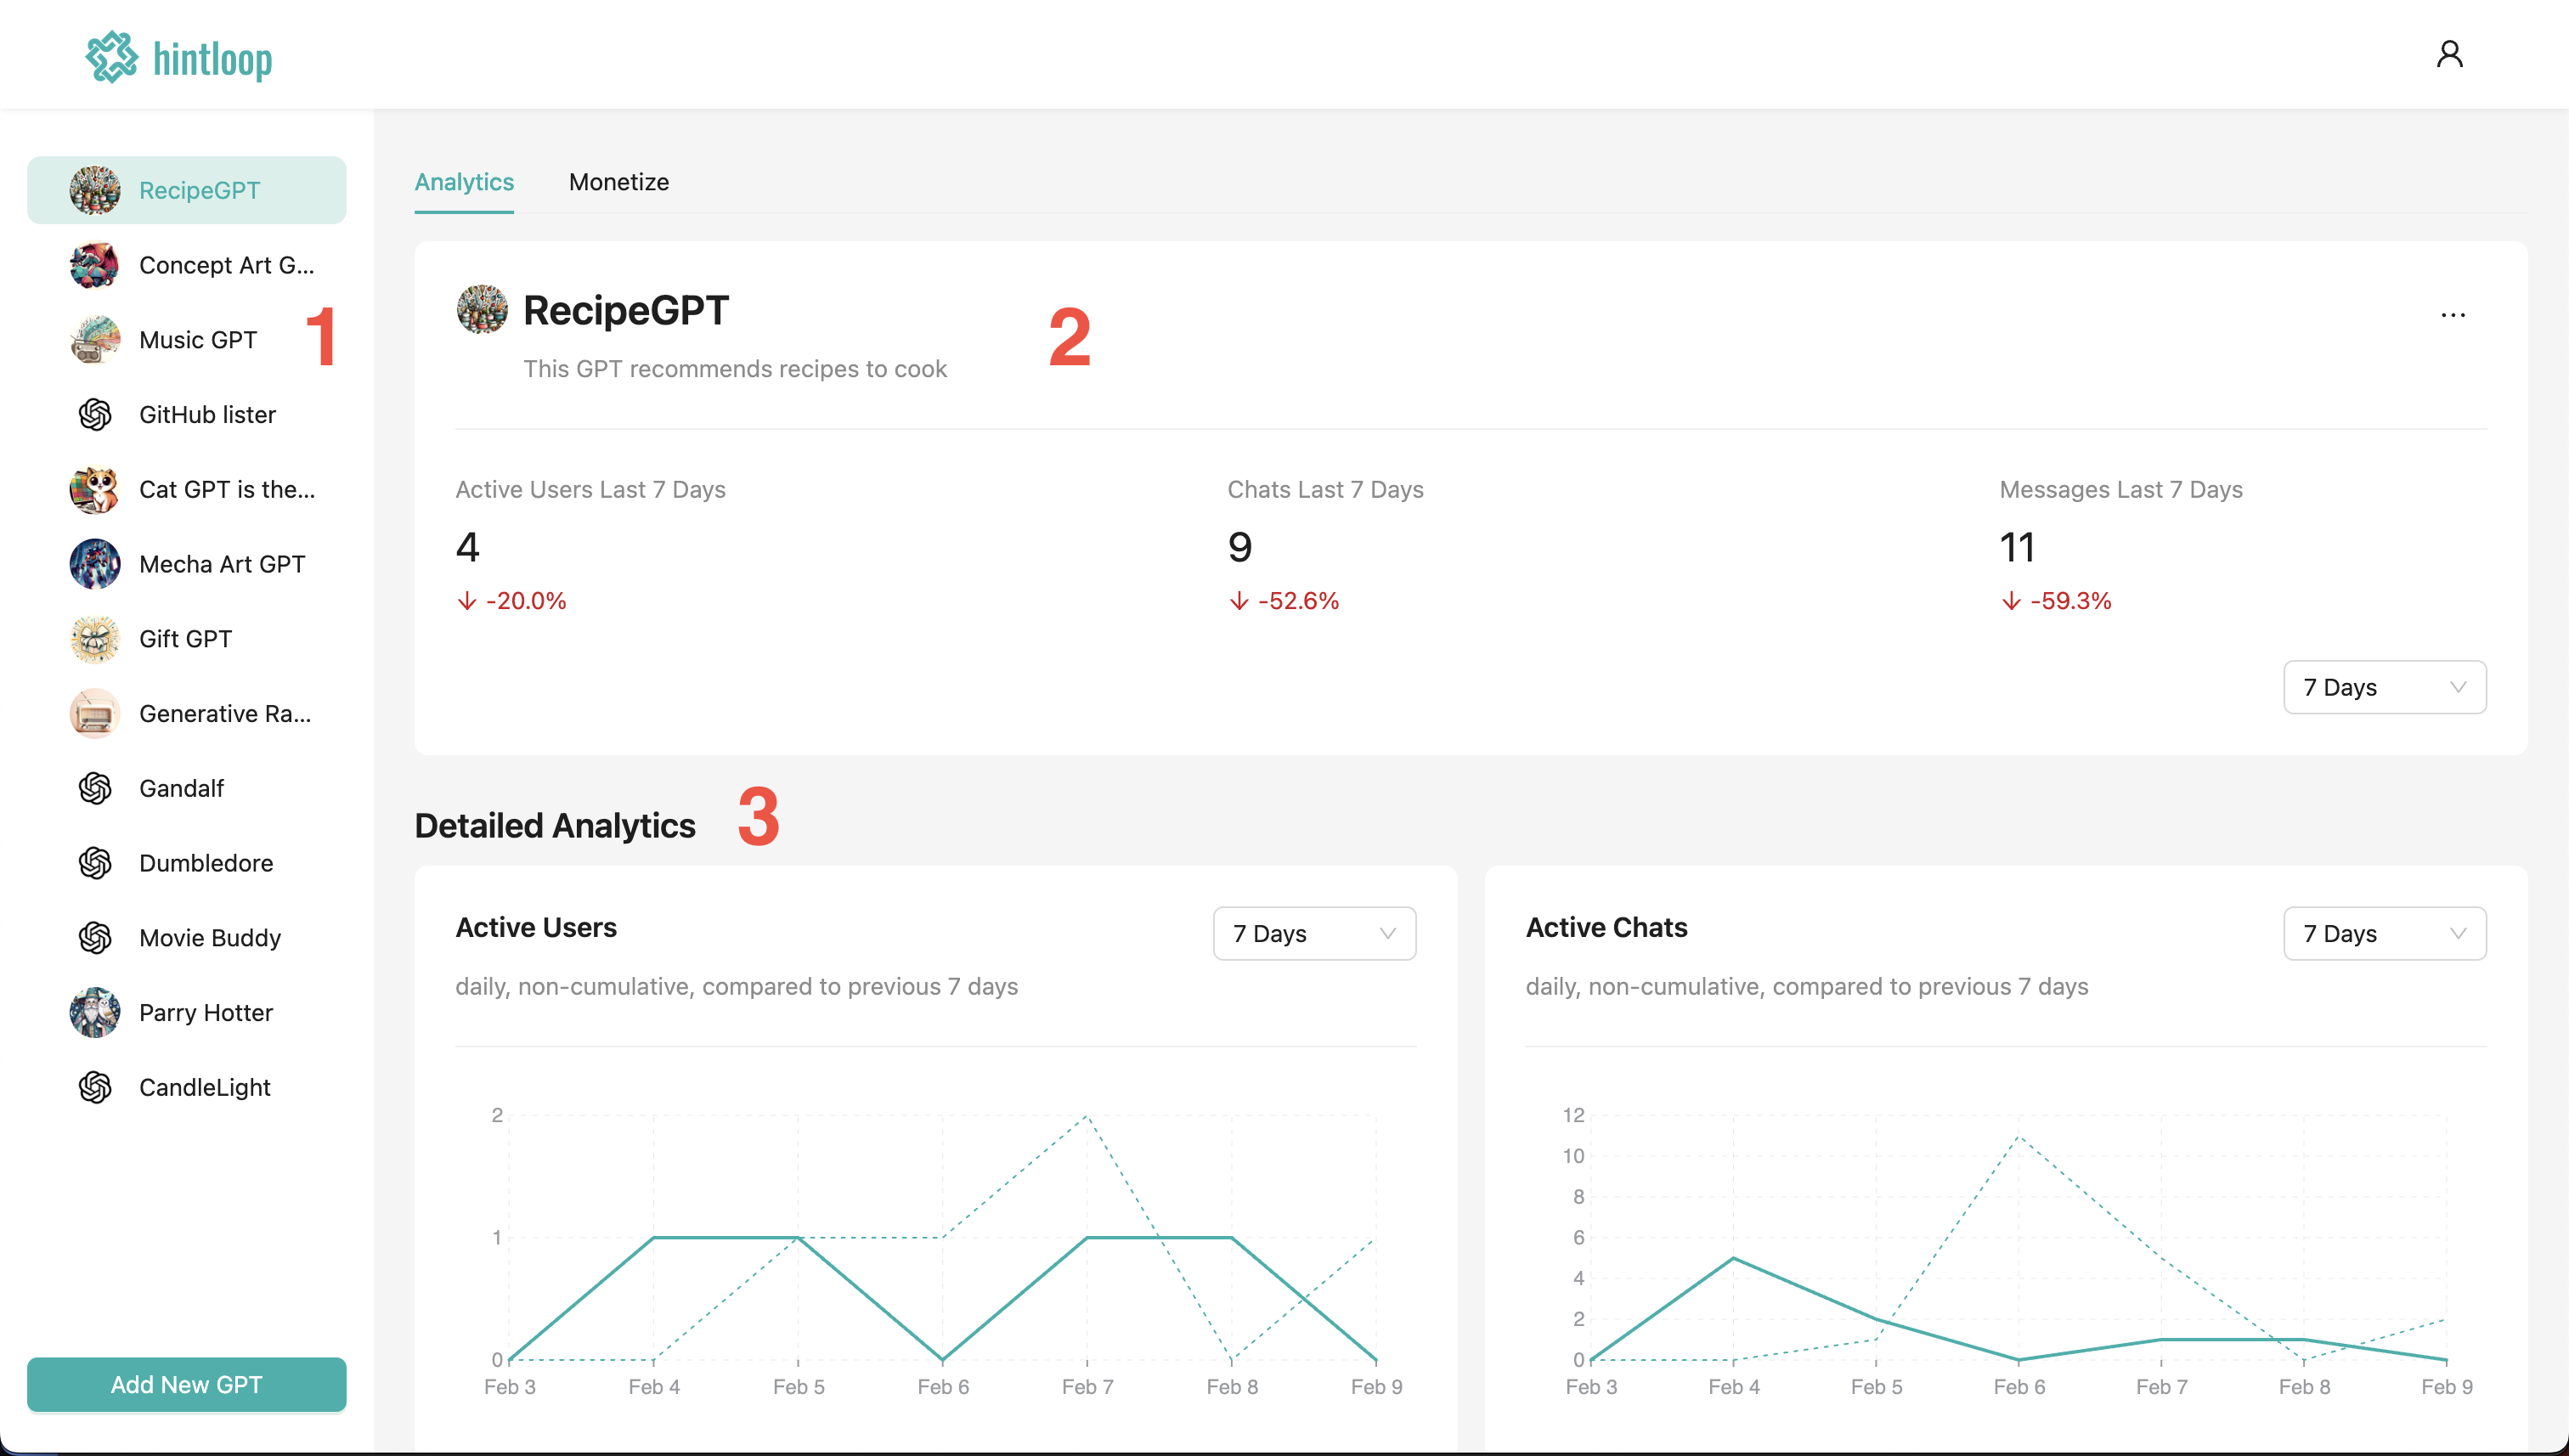
1. The sidebar
The sidebar on the left displays all of the GPTs you added to hintloop. Click on one to open it on the dashboard.
2. Quick stats
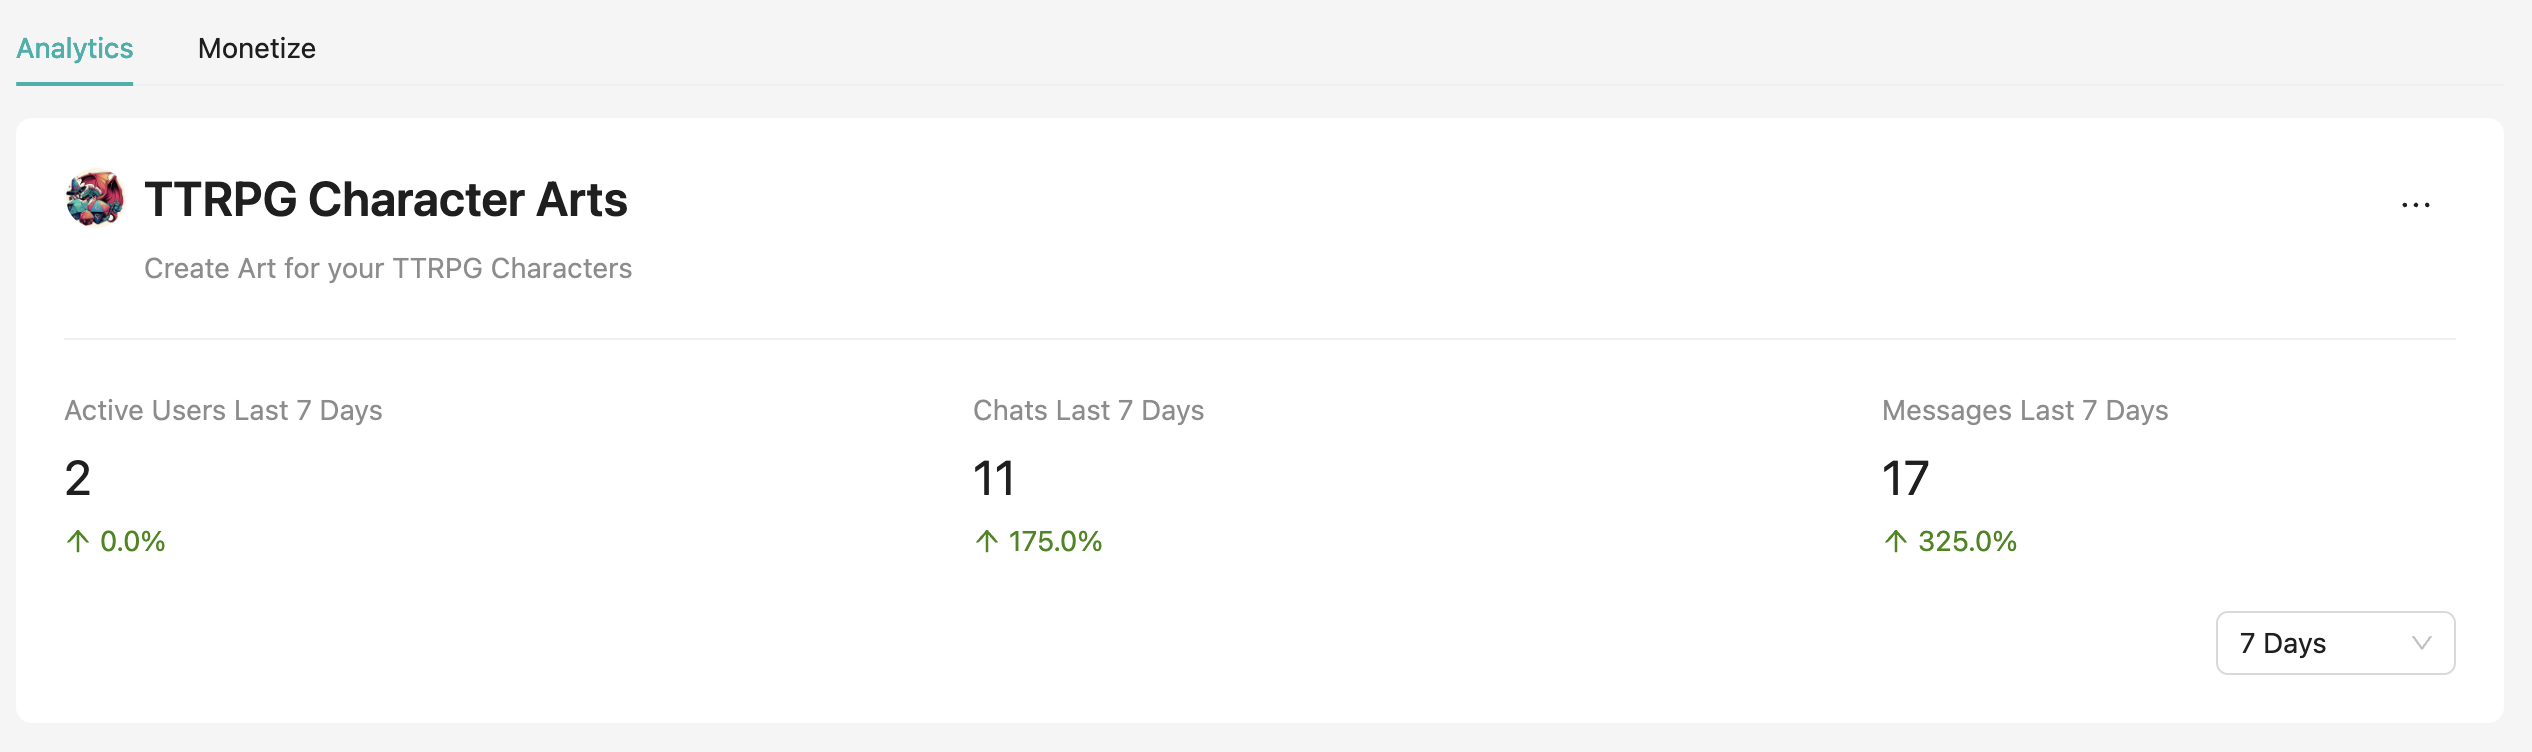
The topmost portion of the analytics tab on the dashboard displays the icon, name, and description of the selected GPT as it appears on the GPT Store. Note that you can name your GPTs on hintloop and it won't affect the name on the GPT Store.
To the right of the GPT name you will find a dropdown menu that allows you to rename your GPT, look up the prompts and API key, and delete your GPT from hintloop.
Below you will see three statistics and a time selector. The statistics display the total number of "Active Users", "Chats", and "Messages" over one of the selected options: 1 day, 7 days, 14 days or 30 days. This selector ccontrols only these three statistics, and the charts have their own selectors.
2. Detailed analytics
Currently, hintloop displays three charts with usage statistics: daily active users, daily active chats, and daily sent messages. You can zoom in and out of the charts by selecting the corresponding time period in the bottom right corner of each chsart. The dotted line is the value from the previous time period e.g. if you select "7 days" on the messages chart then the dotted line will show how many messages your GPT received 7 days prior to the date on the chart. Use this tool to track your growth over time.
Wrap Up
Your hintloop dashboard has some useful information about your GPTs like the total number of users that sent at least one messages, the number of chats they initiated, and the total number of messages they sent. Additionally you can see the charts visualizing these statistics changing over time.